Ava 34
30-day index 74 · cov 5 of 6Sleep and recovery dip during an August launch; six wearable-free days; metabolic results stale.
Movement, sleep, nutrition habits, recovery, cardiovascular and metabolic measurements, held in one calm, navigable picture across ninety days. The maths is published, and every gap is shown honestly.
Synthetic sample data. The index is an illustrative wellness index, not a clinical score, a diagnosis or advice.
| Dimension | Sample score (0–100) | Status in index | Latest record |
|---|---|---|---|
| Movement | 79 | Included | 28 Sep |
| Sleep | 72 | Included | 28 Sep |
| Nutrition habits | 71 | Included | 27 Sep |
| Recovery & wellbeing | 71 | Included | 28 Sep |
| Cardiovascular measurements | 81 | Included | 28 Sep |
| Metabolic measurements | — | Stale · excluded | 19 Jul |






05:50Sleep
The night arrives as data before you do. Time asleep and sleep efficiency, estimated by a wrist wearable, land on the date they belong to.
06:40Movement
Steps and active minutes add up along the track. Leave the wearable at home and the day is recorded as a gap, never as zero steps.
17:30Nutrition habits
Two serves of greens and a glass of water, logged in a few taps. A habit log, not a diet assessment.
20:15Recovery & wellbeing
A stretch and a one-to-five check-in. Overnight heart-rate variability follows while you sleep: a human measure beside a device one.
21:30Cardiovascular & metabolic
Some measurements come rarely. A home blood-pressure reading twice a week, a pathology result months apart. Each one carries its date and its age.
NightThe whole sky
Every day folds into one constellation: six stars, ninety days, and every gap left where you can see it.
Take one number apartConcept visualisation · AI-generated scenes, no real person or home
Malik’s illustrative index for the 30 days to 28 September is 64. On its own, that number says almost nothing.
Underneath sit six dimensions. Each layer carries its own sample score, its weight, where its data came from and how fresh it is.
Malik never set up the habits log, so nutrition has no data. Its layer stays empty and the other five share its weight. Counted as zero, it would have pulled the index down to 53.
The index is the weighted average of the layers that have data. Coverage sits beside it, never folded into it.
Movement68
Wrist wearable
29 days of evidence · +13.7 pts
Sleep63
Wrist wearable
19 days of evidence · +12.6 pts
Nutrition habits—
Daily habits log
Missing · excluded, not zero
Recovery & wellbeing63
Wrist wearable · Wellbeing check-in
22 days of evidence · +12.5 pts
Cardiovascular measurements65
Wrist wearable · Home blood-pressure cuff
29 days of evidence · +12.9 pts
Metabolic measurements59
Pathology result · Tape measure
3 days of evidence · +11.9 pts
(68.3 + 62.9 + 62.6 + 64.5 + 59.3) ÷ 5 = 63.5 → 64
Coverage 5 of 6 · equal weights · 21-day freshness · method vital-index-demo-1.0
Each dimension gathers a handful of everyday measurements with explicit units and sources. Its sample score is a curated 0–100 value for this demo, not a clinical rating of the measurements beneath it.
 MovementDaily steps and minutes of moderate-or-vigorous activity, from a wrist wearable.steps/day · min/day
 SleepTime asleep, and sleep efficiency: the share of time in bed actually spent sleeping.h/night · % efficiency
 Nutrition habitsSelf-logged serves of vegetables and fruit, and water. Habits, not a diet assessment.serves/day · L/day
 Recovery & wellbeingOvernight heart-rate variability beside a simple self-rated wellbeing check-in.ms (RMSSD) · 1–5 check-in
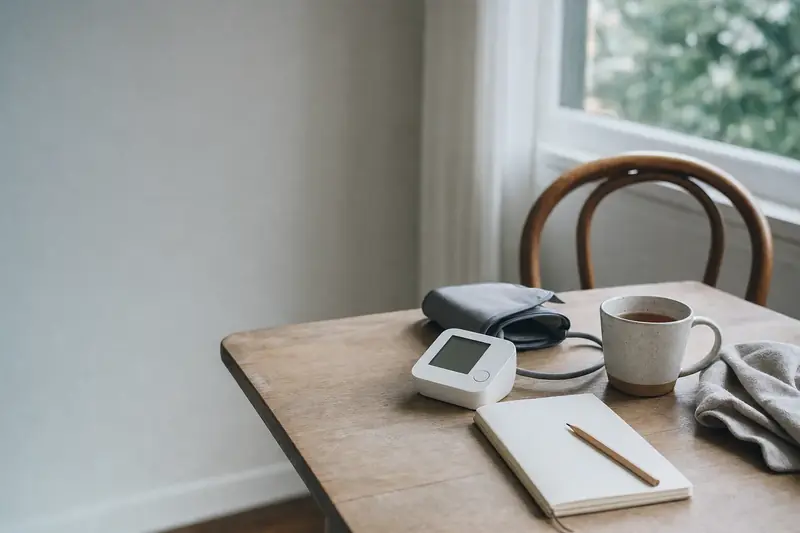 Cardiovascular measurementsResting heart rate from a wearable and home blood-pressure readings. Measurements, not a rating.bpm · mmHg
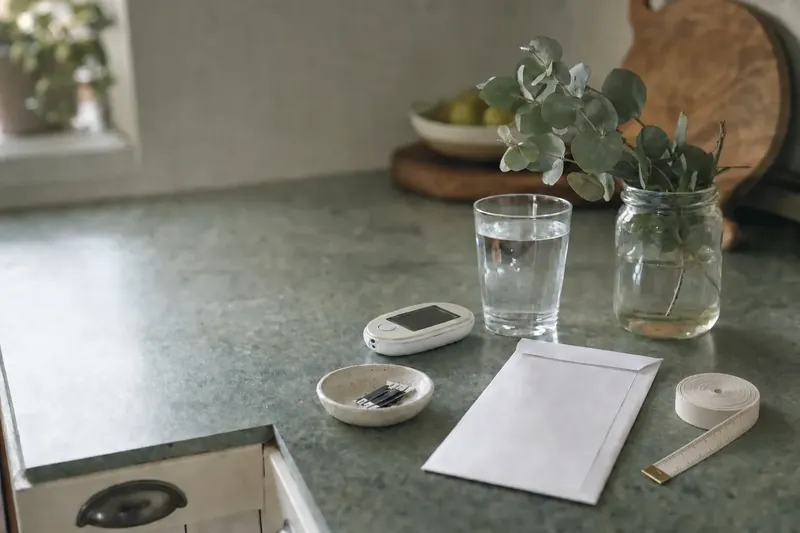 Metabolic measurementsOccasional fasting glucose results and waist measurements. Sparse by nature, so freshness matters most here.mmol/L · cm
Photography-style scenes are AI-generated for this concept. They show no real person or home.
When a dimension has no recent data, Vital leaves it out of the index and says so. Coverage falls visibly; the index doesn’t quietly drop as if you had suddenly become unwell.
Try it: switch dimensions off as if their data had never arrived. The index is recalculated from what remains, and coverage tells you how much of the picture that is.
Read the missing-data ruleThe rolling 7-day index for each synthetic persona, with daily coverage beneath it. Hover or tap to read any day. Hatched bands mark days when the wearable recorded nothing.
Sleep and recovery dip during an August launch; six wearable-free days; metabolic results stale.
A walking routine from late July lifts movement. Nutrition never logged, so it stays out of the index.
Steady routines and a two-week trip without her wearable. Her habits log ends mid-September.
The internal explorer is where the concept goes deep: inspect a dimension, compare two periods, edit the weights, try a labelled what-if, and generate a summary in which every sentence links to the records it cites.
Vital is for understanding information, not judging it. These limits are part of the design, not the small print.
No condition labels, no “abnormal” flags, no clinical interpretation of any measurement.
No disease-risk scores or forecasts. What-if scenarios are arithmetic on typed-in values, nothing more.
No medication changes and no treatment suggestions. It helps you prepare questions for a clinician instead.
This concept accepts no real health data. Every person and number here is synthetic.
Switch between Ava, Malik and Ruth, change the time range, and see exactly how each number was made.